Research Methods
Ion Beam Analysis
The analysis methods available at the Louisiana Accelerator Center are developing all the time. However, some basic methods are almost unchanged. When ions interact with materials a wide range of different processes can take place. Some take place inside the material while some produce particles (quanta) that are emitted from the material as shown in Fig. 1.
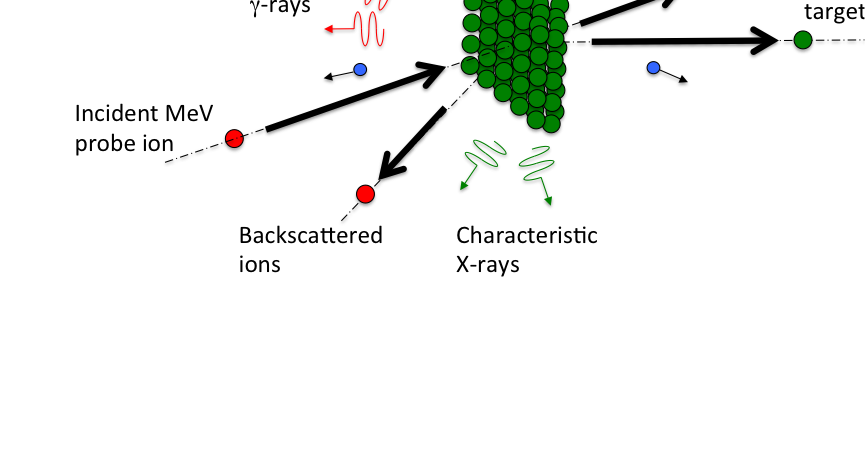
Fig. 1: Characteristic particles emitted from a sample material under MeV ion bombardment (Image: H.J. Whitlow)
The basis of Ion Beam Analysis (IBA) is to measure the characteristic quanta and use this to deduce characteristics of the sample, such as composition and structure.
Particle Induced X-Ray Emission (PIXE)
One of the simplest methods is to measure the spectrum of characteristic X-rays when the sample is irradiated with energetic ions such as 2 MeV protons. This is known as Particle Induced X-ray Emission (PIXE). The intensity of the dfferent characteristic X-ray peaks give a measure of the different elements present in the sample. Fig. 2 shows a PIXE spectrum showing the characteristic X-rays of a tooth that had undergone root canal treatment.
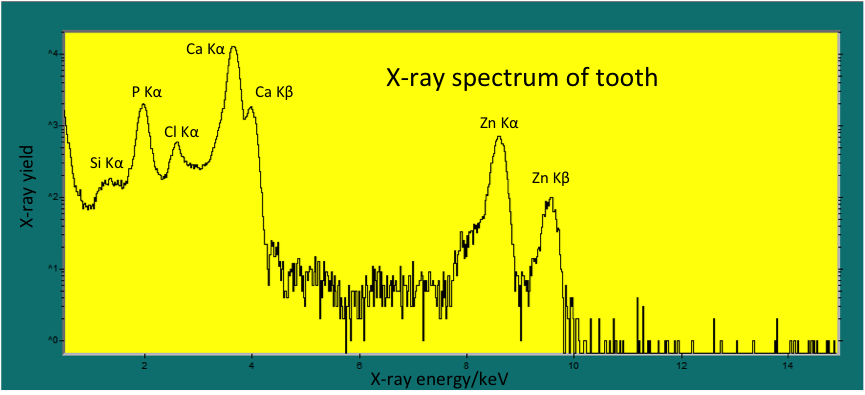
Fig. 2: PIXE spectrum of a tooth (Archive sample) taken with 2 MeV protons that had undergone root canal treatment (Image: H.J. Whitlow, E. Guibert and P. Jeanerette)
The characteristic X-rays from P and Ca in Fig. 2 originate from calcium hydroxyapatite, which is the mineral content of teeth while the Zn X-rays originate from the ZnO material used to fill the root canal. The Cl was indicative of chlorhexidine residue from the oral surgical procedure.
PIXE measurements need not be carried out vacuum. The measurement can be also carried out at ambient pressure by bringing the proton beam out into atmosphere through a thin radiation window. Fig. 3 illustrates an external beam configuration.
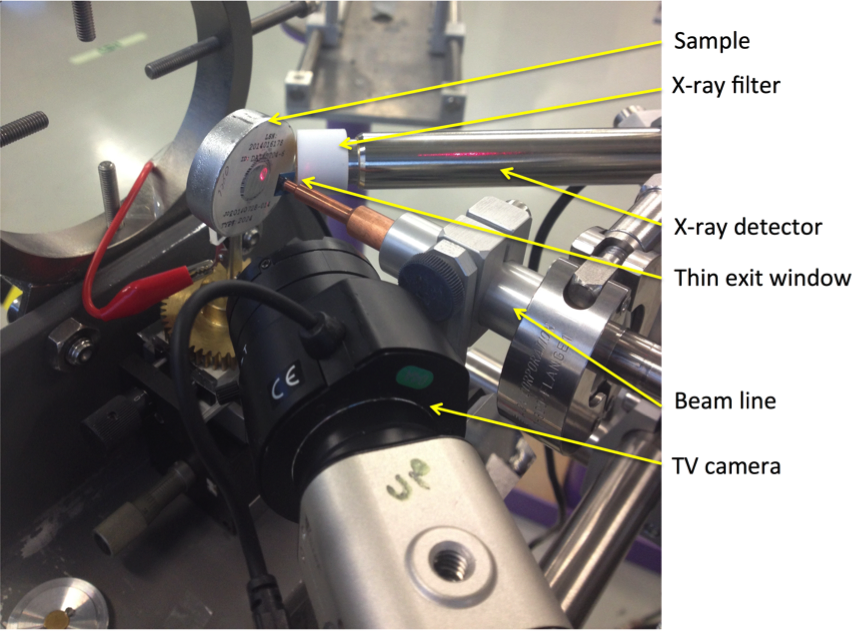
Fig. 3 PIXE set-up for measuring the composition of historical artefacts. The TV camera is used to locate the position the beam spot impinges on the sample by triangulation using a laser beam. (Image: H.J. Whitlow, E. Guibert, L.P. Wang C. Degrigny)
Nuclear Reaction Analysis
Nuclear Reaction Analysis (NRA) is a range of techniques that involve characteristic nuclear reactions. These are described in shorthand notation A(x,y)B where A is the isotope that is bombarded with particle x and producing a particle y and the residuum B. For example, 15N(p,αγ)12C describes a reaction where protons bombard a 15N nucleus and produce an alpha particle and a γ-ray leaving a 12C residual nucleus. This reaction has a so-called resonance for 428 keV protons in the laboratory frame, where the probability is dramatically increased compared to other energies. Protons are slowed down as they penetrate matter, the method may be used to sample the nitrogen content of a solid sample at some depth below the surface. Then by stepping the proton energy a nitrogen concentration vs. depth distribution can be measured. One significant difference with NRA compared to other methods is that the NRA method probes specific isotopes rather than specific elements. Depending on the nuclear reaction used, the detected particle can be a proton, neutron, deuteron, 3He, 4He or γ-ray. Different types of nuclear reaction can be used such as non-resonant, resonant or threshold reactions. The depth information may be obtained by stepping the projectile energy (resonant and threshold reactions) or by measuring the energy distribution of emitted particle in a particular direction.
Particle Induced Gamma-ray Emission (PIGE)
A special case of nuclear reaction analysis is Particle Induced Gamma-ray Emission (PIGE). This uses characteristic (p, γ) reactions to detect light elements in a similar way to PIXE. In this case a Ge-detector is used to precisely measure the energy of the emitted γ-rays. PIGE is complimentary to PIXE because it is most sensitive for light elements with atomic numbers less than 14. PIXE on the other hand is largely blind to elements below Na because the X-rays are too low energy to be detected using a Si detector.
Rutherford Backscattering Spectrometry (RBS)
Rutherford Backscattering Spectrometry (RBS) is based on measuring the energy of elastically backscattered ions. This method builds upon Rutherford’s classic experiment which showed that alpha particles were scattered in a backwards direction from a thin gold foil.
The fraction K of the ion’s initial energy , E0 at which ions are elastically backscattered depends on the mass of the ion and target nucleus and the scattering angle. In a simple RBS experiment (Fig. 1) where the sample is a thin foil made up of two elements one of which, A is heavier than the other B. In the experiment the energy and mass of the projectile ion are set by the accelerator and the scattering angle, θ is fixed by the system of apertures, the ions that backscatter from A will have a higher energy than those that backscatter from B. (Fig. 1). The energy with which they backscatter is set by their mass. Hence the energy spectrum has two peaks. The position of a signal from an element then gives information as to the elements identity. The area (and height) of the peaks for element A and B will be proportional to the amount of element A and B present. Then the amplitude of the signal from an element then gives information about the concentration of the element. RBS can also give information about the depth below the surface at which the element is located. This makes use the loss of kinetic energy as the ion penetrated the material on both the inward path before the scattering event and on the outward path after scattering. In Fig. 3 the backscattered ions with the highest energy do not penetrate the material are scattered from the surface of the heavy element. Then as the ions penetrate deeper they lose energy on the inward and outward paths so they backscatter with progressively lower energy. When they reach the buried interface between the light and heavy elements the ions encounter only the light elements and hence backscatter at a lower energy because of its lighter mass. This gives rise to the trapezoidal signals for the heavy and light elements. An example of and RBS spectrum from a 80 nm heavy element layer (tungsten deposited by Low Pressure Chemical Vapour Deposition (LPCVD) on a lighter substrate (silicon) is shown in Fig. 4.
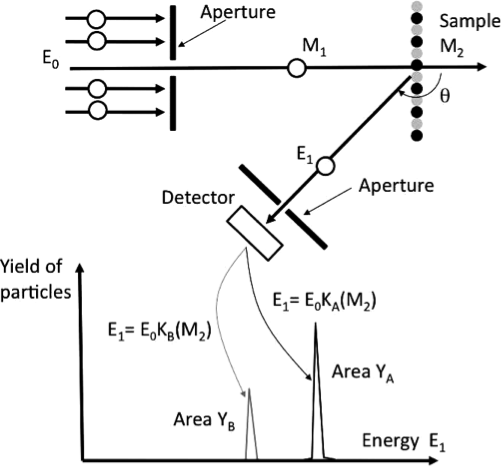
Fig. 1: Schematic illustration of the simple RBS experiment where the sample is a thin foil made up of two elements. (From: R. Hellborg and H.J. Whitlow; Industrial Aspects of Ion Beam Analysis, in; Industrial Accelerators and their application; (eds.) R.W. Hamm and M.E. Hamm, (World Scientific, 2012)183-242.)
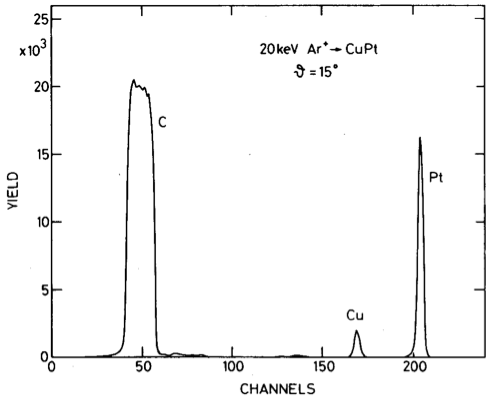
Fig. 2: RBS spectrum from a sub-monolayer thick Cu-Pt alloy on a thin carbon foil. (From: H.H. Andersen, B. Stenum, T Sørensen and H.J. Whitlow Transients in the composition of material sputtered from alloy targets; Nucl. Instrum. and Method. B2(1984)601. )
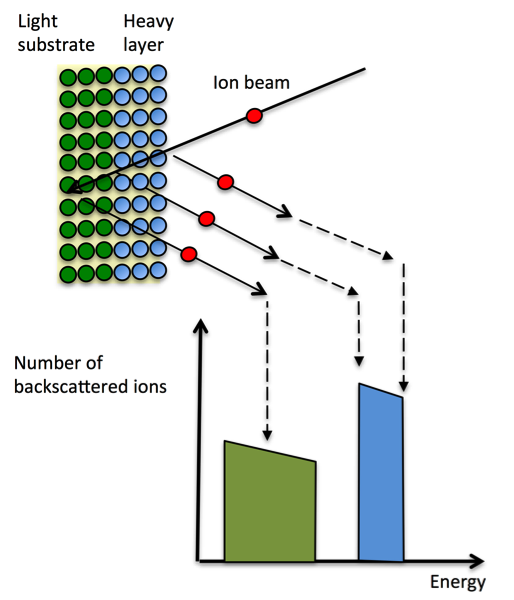
Fig. 3: Illustration of the interpretation of a RBS spectrum from a thick layer of a heavy atomic mass element (blue) on a lighter atomic mas substrate (green). (After: R. Hellborg and H.J. Whitlow; Industrial Aspects of Ion Beam Analysis, in; Industrial Accelerators and their application; (eds.) R.W. Hamm and M.E. Hamm, (World Scientific, 2012)183-242.)
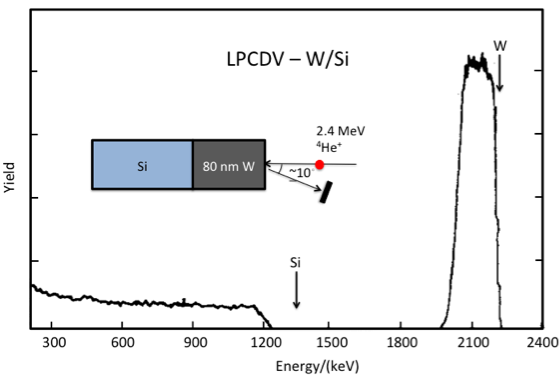
Fig. 4: RBS spectrum for backscattering of 2.4 MeV 4He+ ions from a tungsten layer on silicon. From the difference in energy for scattering from tungsten at the surface and the low energy edge (2080 keV) the thickness the tungsten layer was determined to be 80 nm. (After: H.J. Whitlow, Th. Erikson, M. Östling, C. S. Petersson, J. Keinonen and A. Anttila; Fluorine in LPCVD-W/Si contact structures: Inclusion and thermal stability. Appl. Phys. Lett. 50(1987)1497.)
Elastic Recoil Detection Analysis (ERDA)
RBS is blind to elements lighter than the projectile ion because backscattering is not possible. Hydrogen is an important element as it is a major component many organic materials such as polymers and biological materials and it is of central importance in hydrogen energy storage technology. Hydrogen can be analysed in a similar manner to RBS by measuring the forward scattered recoils instead of the backward scattered ions. This is termed Elastic Recoil Detection Analysis (ERDA). The configuration for ERDA is shown in Fig. 5. He ions (red) bombard the surface at a glancing angle. Hydrogen recoils (blue) are ejected in the forward direction along with scattered He ions. He ions have a higher stopping than protons and the He ions are stopped by a 10-12 µm thick mylar stopper foil which allows the hydrogen recoils through but stops the scattered He ions.
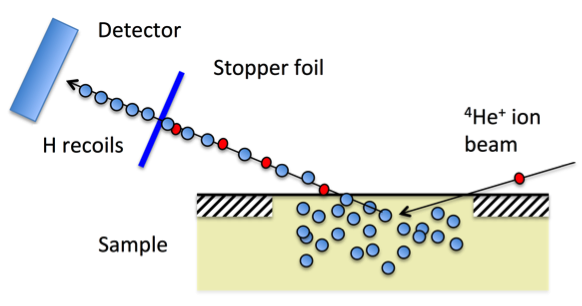
Fig. 5: Schematic illustration of stopper-foil ERDA method. (Image: H.J. Whitlow)
As in the case of RBS the recoils scattered from the surface have the highest energy. An important advantage with ERDA is that it is the target atom itself that recoils, it carries directly elemental identity information as well as it depth of origin information carried by the energy. The elemental identity information can be read-out using a suitable detector system such as a Time of Flight-Energy detector telescope. This enables signals overlapping in energy to be separated according to their mass.
MeV Ion Micro/Nanoprobe Methods
The basis of ion micro/nanoprobe is that the ion beam is focused down to a small spot by means of a lens system. This can be used with PIXE, RBS and stopper-foil ERDA to provide 2D and even 3D compositional mapping by moving the spot over the sample by sweeping a electric and magnetic fields, or mechanically moving the sample. A further possibility is to measure other signals such as the energy loss in passing through the sample (Scanning Transmission Ion Microscopy STIM) ionoluminescence and the number of free charge carriers introduced by the beam (Ion Beam Induced Charge IBIC). A micro/nanobeam can also be used for ion beam lithography (proton beam writing).
The basis of an ion micro/nanobeam is that a demagnified image of an illuminated aperture is projected onto the sample. This requires a converging lens. It work just like a magnifying lens can be used to focus a tiny image of the sun onto a piece of paper. The lenses used are based on specially shaped magnetic fields and produce a de-magnified image on the sample of an aperture illuminated with ions. Then by using the different analytical methods such as PIXE and RBS and scanning the beam over the sample in the X- and Y-directions a map of characteristic elements can be made. Fig. 16 shows a PIXE map of Ag in a mercury dental amalgam.
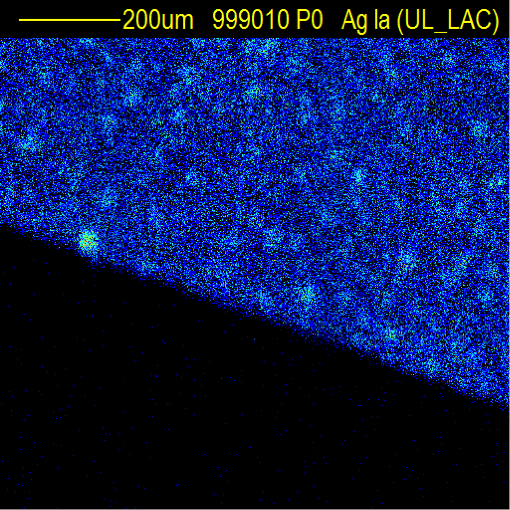
Fig. 16: PIXE map of silver in a dental amalgam. (From: W. Sudprasert, R. Meesat, H. Odeogu, N. Deoli, A. deVera and H.J. Whitlow (Unpublished data).
In direct-STIM a map of the energy loss over the sample is measured. It turns out that because the ion flux for this type of measurement can be very small, the beam may be focused to a very fine spot. In this case a map of the energy loss can be used to measure fine structural details with a resolution of just 50 nm, or less. Fig. 16 shows a Direct-STIM image of a human breast cancer cell. The nucleoli in the nucleus and the cell wall can be easily distinguished. Note the sharpness of the cell wall.
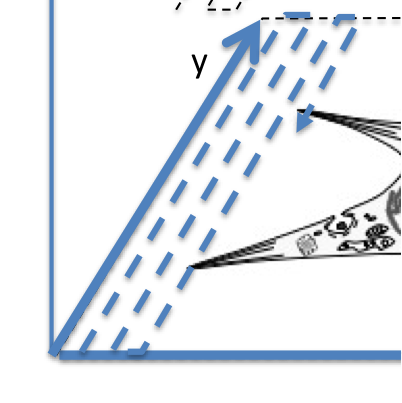
Fig. 16: Direct-Scanning Transmission Ion Microscopy (Direct-STIM) image of a human breast cancer cells. The field size is 15 x 15 µm. (From: M. Ren, J.A. van Kan, A.A. Betiol, Lim D, Chan Y.G. Bay B.H:, H.J. Whitlow, T. Osipowicz and F.Watt; Nucl. Instrum. and Methods B 260(2007)124.
MeV Ion Beam Lithography (Proton Beam Writing)
The focused MeV ion beam can be used to modify the material in patterns. The focused beam is moved over the sample and turned on and off to write a pattern on the surface of the sample. In resist polymers such as SU-8 and PMMA a latent image with altered chemical structure is produced. This can later be developed to produce a pattern of regions that have been removed and regions where the resist film remains. In other material such as silicon, silica and glass the radiation damage modifies the electronic structure, which can also be developed to make 3D structures. Fig. 17 shows a inter-dignitated metal pattern where the vanishingly small proximity effect with proton beam writing has been taken into account.
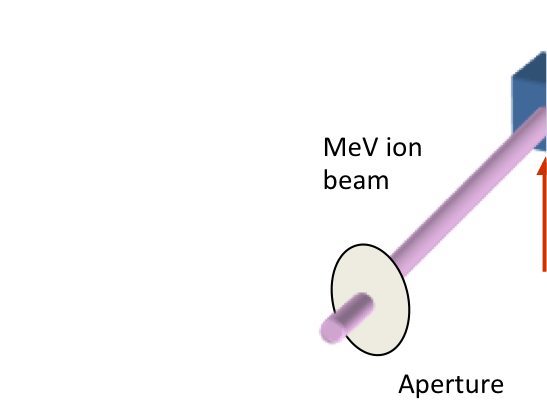
Fig. 18: Interdigitated electrode pattern on silicon produced by proton beam writing (From: H. J. Whitlow, M. L. Ng, V. Auželyté, I. A. Maximov, J. A. van Kan, A. Bettiol and F. Watt Lithography of high spatial-density biosensor structures with sub-100 nm spacing by MeV proton beam writing with a minimal proximity effect. Nanotechnology 15 (2004) 223.)
The method is not restricted to using focused MeV ion beams. Broad beams can be used with various aperture mask methods to produce patterns. One particularly significant advantage of the MeV ion beam lithography techniques is that they can be used to directly write micro- and nanofluidic devices. An example is shown in Fig. 19 which is a chip actuated by surface tension that can be used to perform sequential steps in a chemical analysis.
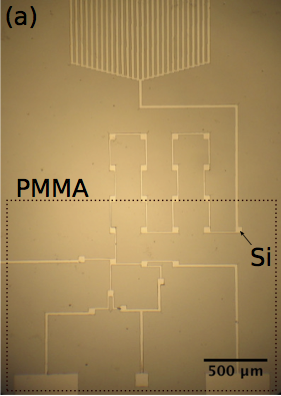
Fig. 19: A microfluidic chip for performing multi-step chemical analysis procedures. (From: N. Puttaraksa, H.J. Whitlow, M. Napari, L. Meriläinen, L. Guibert; Development of a microfluidic design for an automatic lab-on-chip-operation Microfluid Nanofluid 20(2016)141-152, DOI 10.1007/s10404-016-1808-0)